Satellite Imagery and more...
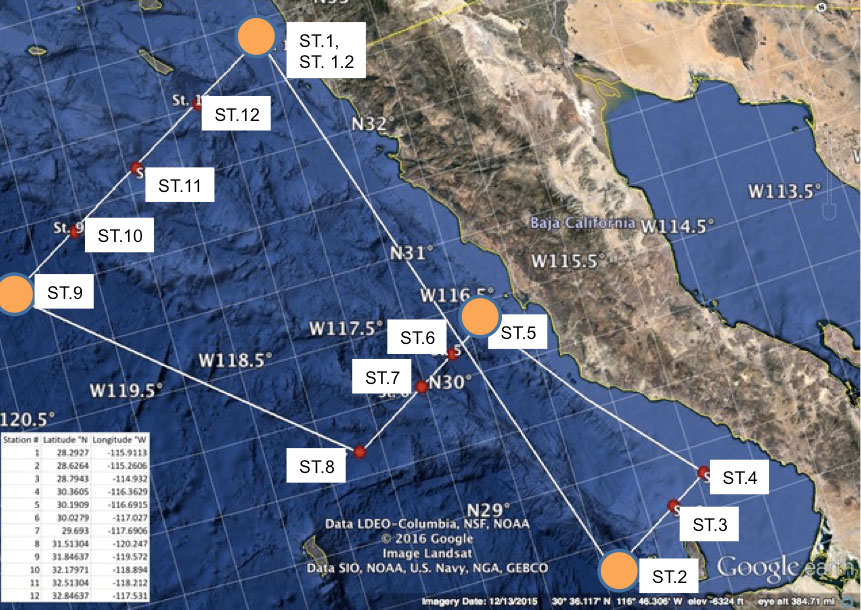
SP1713 - UCYN-A Cruise
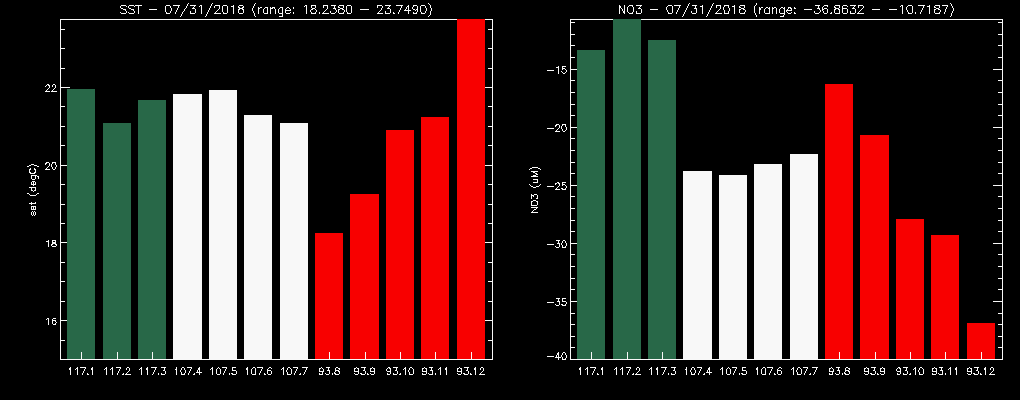
Latest SST and derived NO3
(Last updated: January 1, 2018, data usually one day behind)
GHRSST-MUR SST, view plots based on G1SST
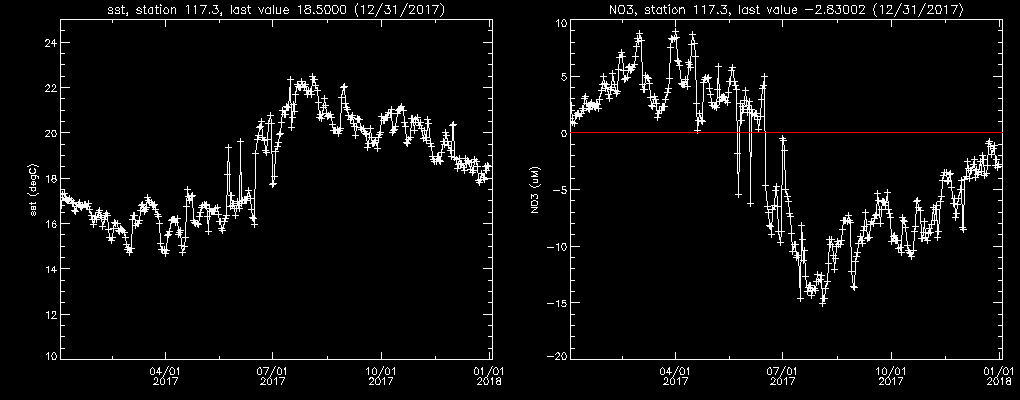
Time series SST and derived NO3
| - - - Station 1, Line 117 - - - |
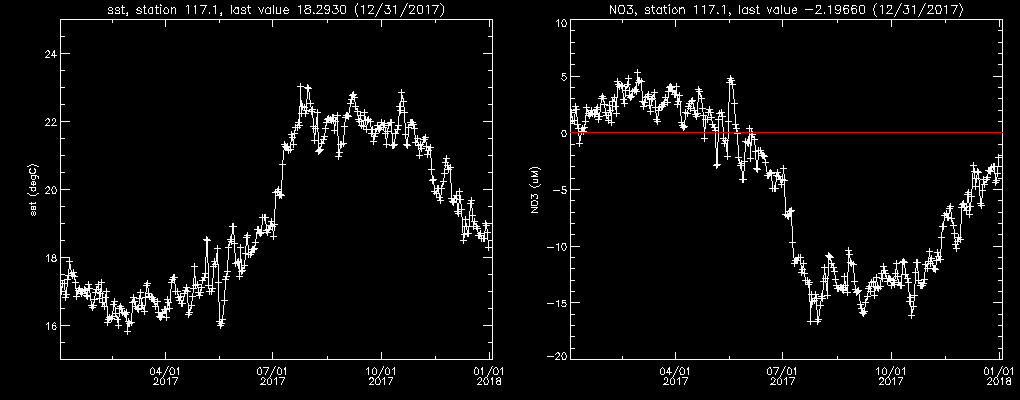 |
| - - - Station 2, Line 117 - - - |
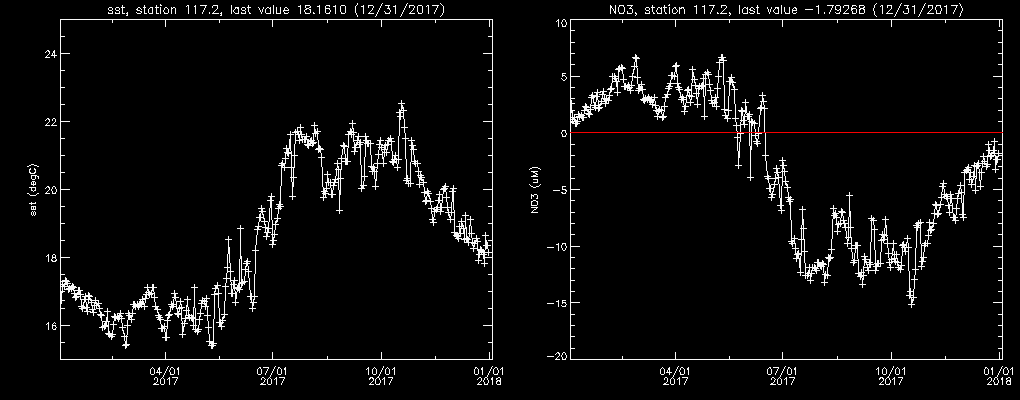 |
| - - - Station 3, Line 117 - - - |
 |
| - - - Station 4, Line 107 - - - |
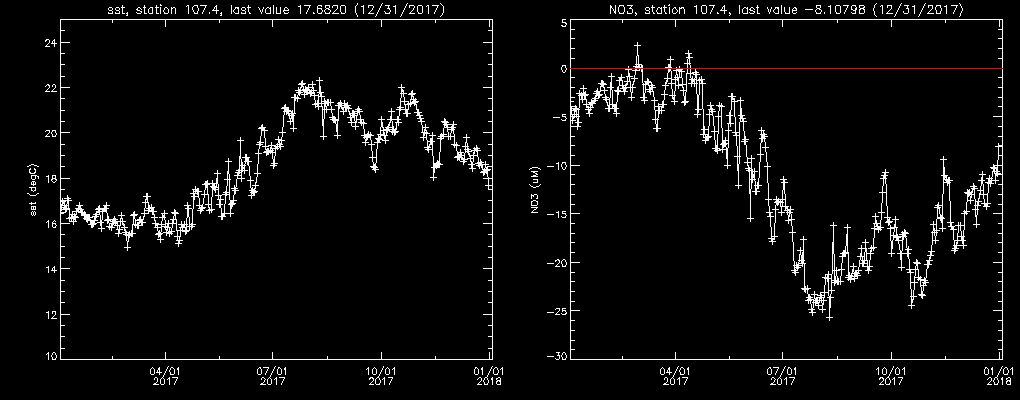 |
| - - - Station 5, Line 107 - - - |
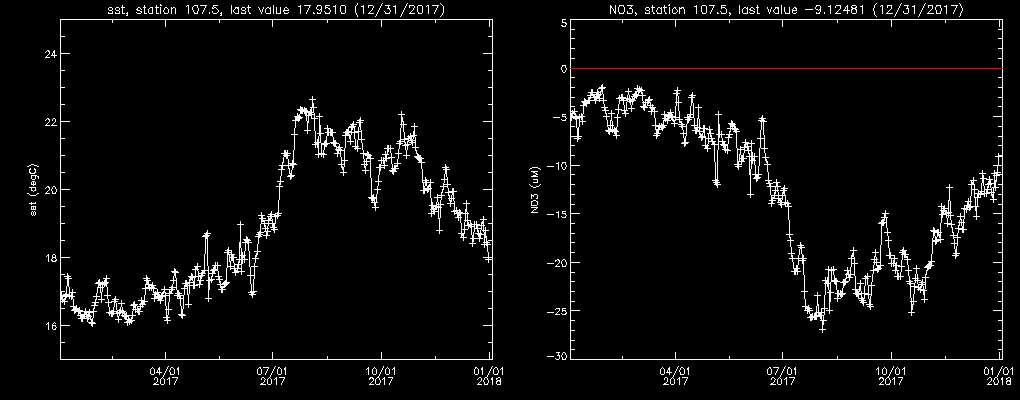 |
| - - - Station 6, Line 107 - - - |
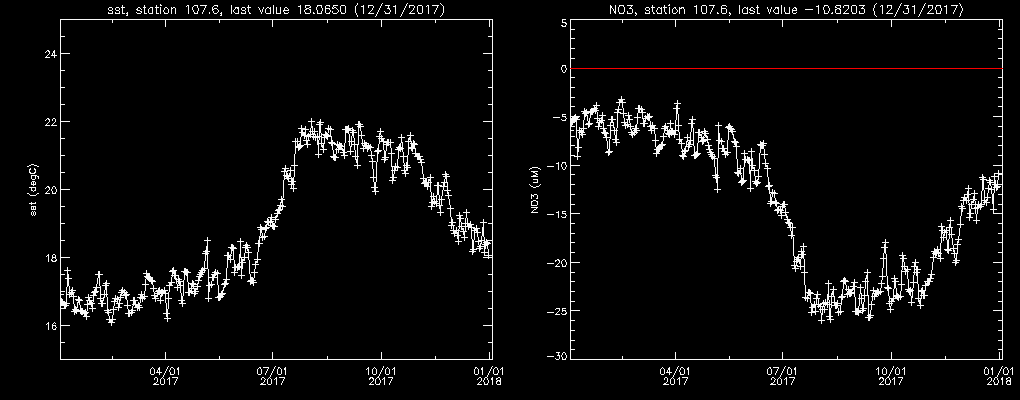 |
| - - - Station 7, Line 107 - - - |
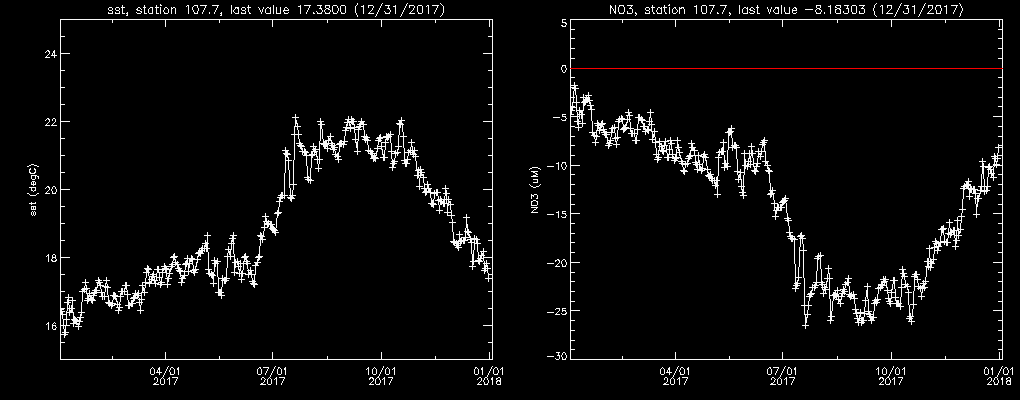 |
| - - - Station 8, Line 93 - - - |
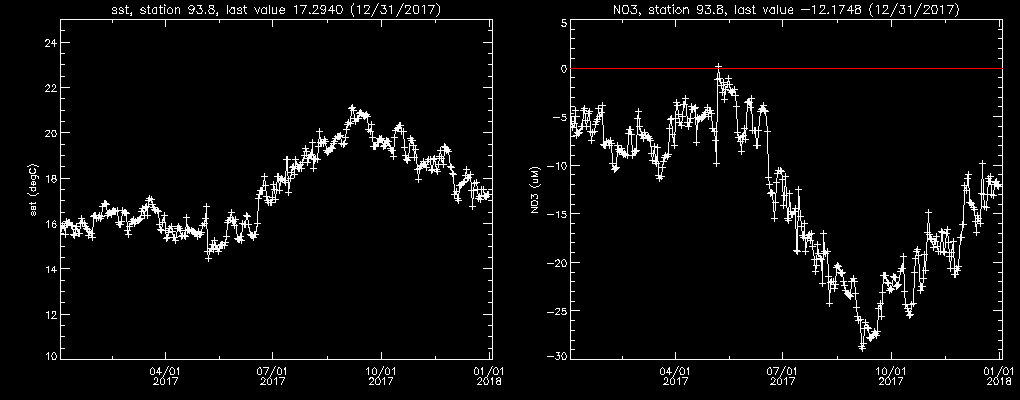 |
| - - - Station 9, Line 93 - - - |
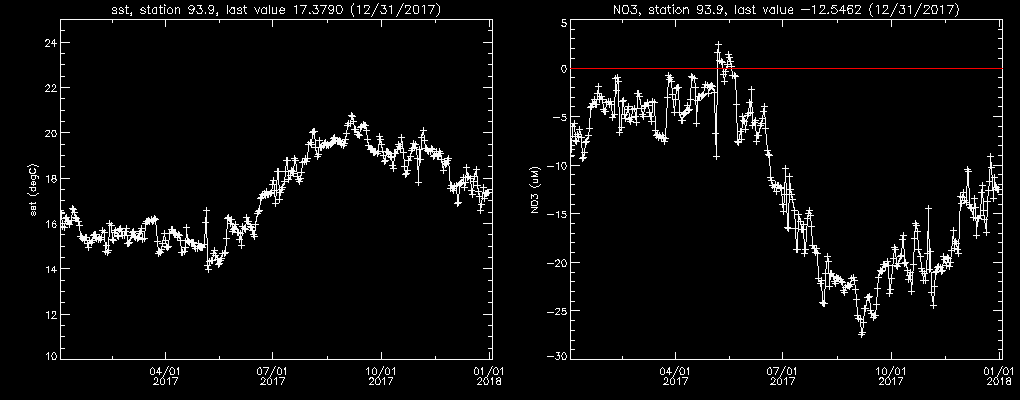 |
| - - - Station 10, Line 93 - - - |
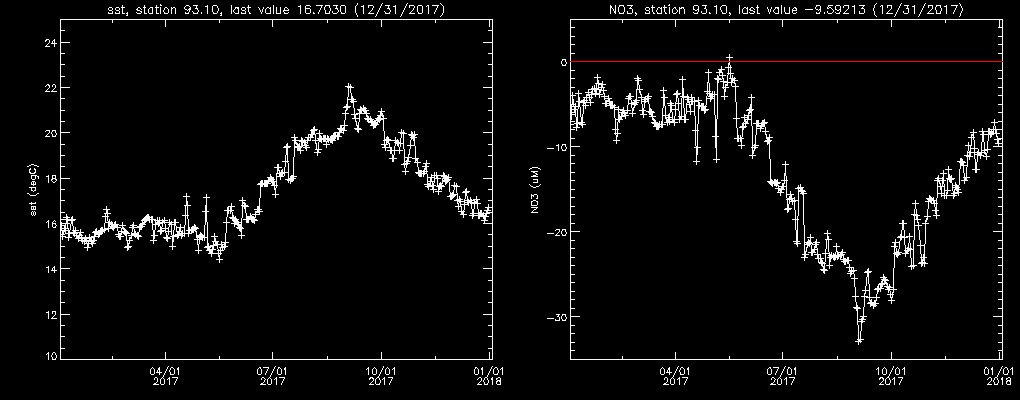 |
| - - - Station 11, Line 93 - - - |
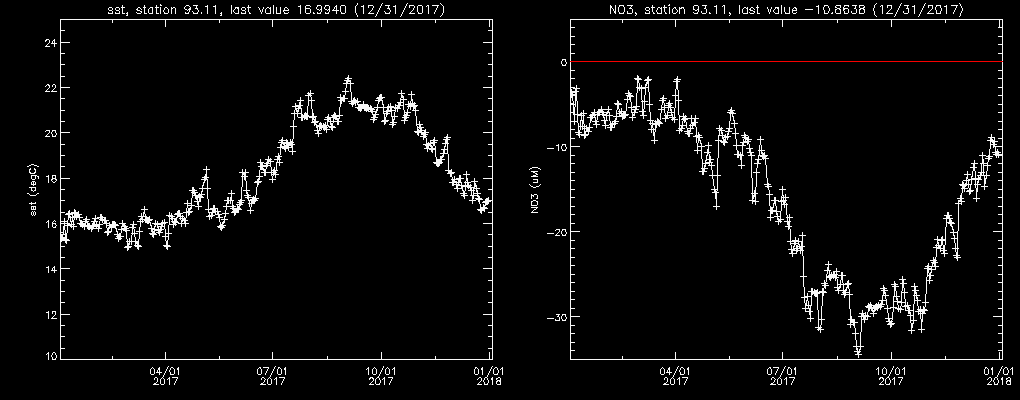 |
| - - - Station 12, Line 93 - - - |
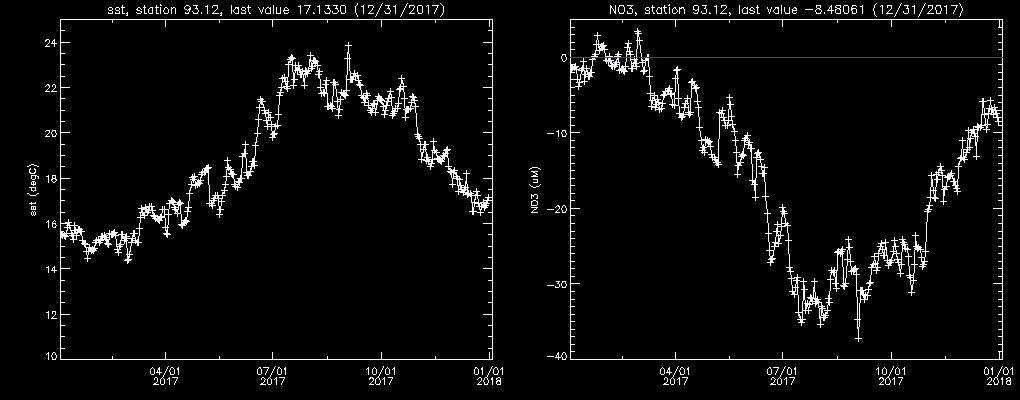 |
Chl based on daily L3b data from MODIS/Aqua and VIIRS (OCI algorithm)
Sea Surface Height anomaly extracted from near-real time all-sat merged (Copernicus MEMS) (was: AVISO)
SST extracted from Global 1 km SST data (GHRSST-MUR)
NO3 calculated from SST according to Hernandez-de-la-Torre et al. 2003
Contact: Gert van Dijken gertvd@stanford.edu